")
Growing ‘Anomalies’
When a theoretical model is not working, the logical thing to look for is a trend toward growing anomalies. Below we offer a partial list of solar features that cause problems for mainstream theory but are expected in an electrical model. As the reader will note, the list includes almost all of the prominent attributes of the Sun:
- Solar The spectrum of light from the Sun is characteristic of electrical discharging. Thus the leading solar physicist, Giorgio Abetti, uses the terms ‘electric arc’ and ‘lightning flash’ when explain- ing the solar spectrum and solar flares. More recently, micro-flares have been discovered to occur every few minutes on the Sun, compa- rable to scaled-up thunderstorms on Earth.
- Neutrino deficiency. Solar physicists have acknowledged for decades that the Sun’s output of neutrinos, a by-product of nuclear fusion, is about 1/3 of that expected in the standard solar model. Three types or ‘flavors’ of neutrinos have been identified, and recent attempts to solve the problem require unwarranted assumptions about neutrino ‘change of flavor’ en route from the center of the An electric Sun, however, can generate all flavors of neutrinos in heavy element synthesis at its surface. Therefore, it requires no assumptions about ‘changing flavors’ to hide the deficit.
- Neutrino The neutrino output varies inversely with the surface sunspot cycle. Were they produced in the nuclear ‘furnace’ at the center of the Sun, this relationship would be inconceivable, since solar physicists calculate that it takes about 200,000 years for the energy of internal fusion to affect the surface. In the electrical model, more and larger sunspots mean less ‘lightning’ at the surface, where the nuclear reactions occur. Thus, the decline in neutrinos with increasing sunspot number is expected.
- Solar As pointed out by astronomer Fred Hoyle, given the strong gravity and 5,800 degree temperature of the Sun’s photo- sphere, a very thin atmospheric ‘skin’ should be expected on the Sun, perhaps a few thousand kilometers thick on a sphere 1.4 million kilo- meters in diameter. Instead, the atmosphere balloons out to 100,000 kilometers, where it heats up to a million degrees or more. From there particles accelerate out among the planets. Thus, it could be said that we orbit inside the Sun’s atmosphere! None of this makes any sense for a 5,800-degree body radiating its heat into space. It makes perfect sense in a plasma discharge, with the Sun acting as an anode.
- Neutrinos and solar Neutrino counts have been found to wax and wane with the flux of particles in the solar wind, a predictable effect if the solar wind is part of an electric circuit fueling nuclear fusion on the Sun’s surface.
- Heavy elements. It has long been claimed that heavy elements are born in the flashes of supernova explosions and are then scattered into space, to be recycled into the next generation of But there are far too few supernovae to account for the abundance of heavy elements in stars. An electric star, with innumerable plasma discharge vortexes thousands of kilometers long, possesses the natural particle accelerators and high density to produce the heavy elements right near the surface where their signatures appear in the spectrum. Stars generate their own heavy elements. For example, the Sun’s explosions throw ‘stardust’ into space where some has been captured and shown to have a “surprising abundance” of heavy elements.
- Differential rotation by latitude. The solar wind carries rotational energy away from the Sun so that, under standard assumptions, the Sun should rotate slower at the equator than at higher In fact, this mechanism should have stopped the Sun spinning long ago. But the reverse is the case. In the electric model, external ring currents couple strongly to the lower latitudes and drive the Sun’s rotation, much like a giant homopolar electric motor—a phenomenon first demonstrated by Michael Faraday.
- Differential rotation by Solar physicists are also puzzled by indications that the surface of the Sun rotates more rapidly than the deeper layers. To appreciate the mystery, imagine a suspended spin- ning ball lowered into a tub of still water and spinning faster as a re- sult! The solar wind should remove rotational momentum from the Sun, slowing the surface first. That the surface rotates fastest is direct evidence that the Sun is being driven externally, like an electric motor.
- Equatorial plasma torus. In ultraviolet light the Sun features a hot plasma ‘donut’ encircling its The same phenomenon occurs in laboratory plasma discharges to a positively charged, magnetized sphere. Electrical energy is stored in
the ‘donut’ and occasionally released in powerful flares and coronal mass ejections. This also implies that the currents flowing in the solar torus couple with the surface plasma to drive the ‘anomalous’ equatorial rotation (see also p. 61).
- The standard solar model neither requires nor predicts sunspots, much less their elaborate
cyclical behavior. In the laboratory torus experiment noted above, dis- charges fly from the torus to the mid- to low-latitudes of the sphere. On the scale of the Sun, such discharges will punch holes in the photo- sphere and deliver current directly to lower depths, thus exposing a view of the cooler interior.
ABOVE LEFT is an equatorial view of the encircling ‘plasma donut’ of the Sun, seen in UV light. ABOVE RIGHT is a polar view showing more clearly the ‘plasma donut.’
Credit: ESA/NASA, SOHO
The National Science Foundation’s Dunn Solar Telescope at Sunspot, NM, is revealing striking details inside sunspot penumbrae and hint at features remaining to be explained. Credit: Friedrich Woeger, KIS, and Chris Berst and Mark Komsa, NSO/ AURA/NSF.
“Primary and secondary electric currents
- Sunspot The strange latitudinal migration of sunspots is replicated in the torus experiment by varying the power input. The higher power produces maximum activity near the equator. That sunspots are formed by attractive parallel electric currents, not merely ‘magnetic effects,’ is shown by the mutual attraction of spots having the same magnetic polarity. Like poles of magnets repel!
- Sunspot penumbra. High-resolution images of the rope-like filaments that surround the dark inner umbra of large sunspots show the distinctive characteristics of tornadic charge By giving us a peek beneath the tops of the tornadic lightning columns, sunspots enable us to view directly the solar electrical tornadoes that heat and project gases upward into the bright photospheric granules (see information panel p. 55). In plasma laboratories, this granulation is called ‘anode tufting.’ For the standard solar model, sunspot penumbrae remain a mystery.
- Sunspot There is no coherent explanation for the approximate eleven-year sunspot cycle. In the electrical model the sunspot cycle is induced by fluctuations in the DC power supply from the local arm of
our galaxy, the Milky Way, as the varying current density and magnetic fields of huge Birkeland current filaments slowly rotate past our solar system. The solar magnetic field reversals may be a result of simple ‘transformer’ action ( see left).
- Magnetic field strength. The Sun’s interplanetary mag- netic field increases in strength with sunspot Elec- trically, the relationship is essential, since the interplane- tary magnetic field is generated by the current flow to and from the Sun. As the power increases, sunspot numbers rise (reflecting current input) and the magnetic field strengthens.
- Even magnetic field. The Sun has a generally dipole magnetic field that switches polarity with the sunspot cycle (see top of facing page). Unlike a dipole magnet, which has the field twice as strong at the poles as at the equator,
in the Sun.” Using Alfvén’s circuit diagram of the Sun, Professor Scott offers the following explanation for solar magnetic field reversals: “If the main magnetic field that induces the surface currents is grow- ing in strength, the surface current will point in one direction. If the main mag- netic field weakens, the secondary sur- face currents will reverse direction.” This ‘transformer’ action does not require the solar driving current to reverse direction. Credit: Diagram and explanation are from
- E. Scott’s The Electric Sky, pp. 112-3.
the Sun has a very evenly distributed field strength. This
oddity can be explained only if the Sun is the recipient of electric currents flowing radially into it. These magnetic field-aligned currents adjust the contours of the magnetic field by their natural tendency to space themselves evenly over an anode surface. An internal ‘dynamo’ will not produce this magnetic field pattern.
- The Sun ‘rings like a bell’ and the oscillations at the surface are measured—in a way similar to the study of earthquakes—to determine what is going on deep within the Sun. But what is ringing the bell? If the Sun is a giant ball of lightning the question is answered, since a clap of thunder will rattle the
windows more readily than will a boiling kettle. More accurately, stellar double layers form part of an electrical circuit, which can readily cause pulsation and changes in size. Both are observed.
- Solar It is highly significant that the dominant ‘ringing’ mode of the Sun occurs with a rise and fall of the Sun’s entire surface through 10 kilometers every 160 minutes. As a few specialists have warned, this implies that the Sun is of uniform density throughout, thus negating the conditions for a thermonuclear furnace in a dense core of the Sun!75But there is no surprise in the case of an electric star, where internal electrostatic forces tend to offset gravitational compression.
- Changing size. Astronomers are baffled by the discovery that the outer layer (1% of the Sun’s radius) changes in depth by about 26 km in anti-phase with the number of sunspots. But this effect is predictable behavior for a thin plasma sheath surrounding the Sun. The sheath responds to increasing electrical stress by shrinking.76
The above list of anomalies for the standard solar model surely underscores the fact that it was formulated before science learned all of these dominant attributes of the Sun. Every listed feature, however, follows logically from an electrical model, a fact with far-reaching implications for theoretical astrophysics as a whole.
The Hertzsprung-Russell diagram
In 1911 Ejnar Hertzspung constructed a plot (right) comparing the absolute brightness of stars to their ‘spectral class’ (temperature). He limited his investigation to stars whose distances we could then accurately measure by the ‘parallax method,’ which uses the geometry of lines of sight from opposite points in Earth’s orbit. In 1913 Henry Norris Russell independently repeated this exercise. So the plot is named the Hertzsprung-Russell (HR) diagram.
Since the HR diagram is based on observations— not theory—it offers a useful test of the electric model.
In fact, the model fits very well with the HR
The Sun’s general, evenly spaced magnetic field is seen in this image represented by the short radial arrows.
Credit: September 18, 2003 image from the SOHO Extreme ultraviolet Imaging Telescope. ESA/NASA
75 A. B. Severny, V. A. Kotov, T. T. Tsap, “Observations of Solar Pulsations,” Nature Vol. 259, Jan. 15, 1976, pp. 87-89. “The first alternative is that nuclear ...reactions are not responsible for energy generation in the Sun.”
76 S. Lefebvre, A. G. Kosovichev, “Changes in the subsurface stratification of the Sun with the 11-year activity cycle,” arXiv:astro-ph/0510111, 5 Oct 2005. “the change in radius goes from being in phase with the solar cycle in the deeper layers to out of phase in the shallower layers with a transition at 0.99R⨀. This result could eventually lead to a deeper understanding of the physics behind the changes.”
A modified Hertzsprung-Russell Diagram. To conform with electrical engineering convention the horizontal axis of the H-R diagram is reversed. In the electric star model, the important variable is the current density (represented by the horizontal axis) at the star’s radiant surface. As the current density increases, the discharge becomes hotter and changes color (from red, toward blue), and gets brighter. The luminosity of a star, therefore, depends on its size and the current density at its radiating surface.
Red giants and white dwarfs are off the main sequence because their mode of discharge does not involve bright ‘anode tufting.’
Credit. D. E. Scott, The Electric Sky,
- 169.
diagram. All we need to do to the diagram is relabel the horizontal axis to show increasing current density at the star’s visible surface. Then the increasing brightness of the photospheric arcs will account for the upward slope of the ‘main sequence’ line as you move from left to right.
In the presence of an electric field the energy levels of atoms and molecules are altered, shifting and broadening their spectral lines in what is called the ‘Stark effect.’ In the electric model this effect will, of course, increase with the surface temperature of stars because curves of surface temperature (spectral type) will generally match curves of current density. In other words, the variable plotted on the horizontal axis (current density/temperature) is also one of the factors in the quantity plotted on the vertical axis (luminosity). The more significant this relationship,
the more closely the plot will approach a 45 degree straight line. That the stars do not all fall precisely on a line, but have some dispersion above and below the line, is due primarily to their variation in size.
Astronomers call the relatively straight portion of the HR diagram the ‘main sequence.’ However, the term gives the false impression that stars evolve in time along the line in the HR plot. They do not. They evolve off the main sequence to become dwarfs or giants. This assumption of stellar evolution is necessary in the standard mode because a star slowly consumes itself. However, electric lights do not consume themselves and will operate in a way that reflects several variables, including the available external power. Electrically speaking, the HR diagram is not an ‘evolutionary’ diagram for a star. It is simply a scatter plot—a two dimensional graph representing two variables for each of the objects being graphed. The data graphed by the HR diagram are accurate, while assumptions too often projected on the data are not. When astronomers call red giants ‘old,’ or treat the graph as a guide to the lower limit of the age of the universe they are speaking the language of theoretical assumptions, not fact. As we shall see, red giant stars are not geriatric. And as we’ve already noted the ‘age of the universe’ is a meaningless concept since we know nothing about its birth.
Main sequence stars
In an electric model, stars on the ‘main sequence’ in the HR plot may be characterized as self-regulating cosmic power transformers. As such they concentrate diffuse galactic electrical energy, converting it into heat and light. Like the Sun, they derive their luminosity from very bright ‘anode tufts’ in their plasma sheaths. A star’s position on
the HR plot is due to each star’s size and the current density at its surface.
However, when seen in X-rays it is obvious that the Sun has a variable power supply (see information panel p. 61). Why doesn’t the Sun fade and brighten in step with the solar cycle? Why do most stars on the main sequence shine steadily? The answer is remarkably simple. As noticed by Scott, the tufted plasma sheath above the stellar anode seems to be the cosmic equivalent to a ‘PNP transistor,’ a simple electronic device using small changes in voltage to control large changes in electrical power output. The tufted sheath thus regulates the solar discharge and provides stability of radiated heat and light output, while the power to the Sun varies throughout the sunspot cycle.77
This ability of the Sun’s plasma sheath to modulate the solar cur- rent was demonstrated dramatically in May 1999, when the solar wind stopped for two days.78 The bizarre event makes no sense if the solar wind is being ‘boiled off’ by the hot solar corona. But in electrical terms, its regulating plasma sheath performed normally and there was no noticeable change in the Sun’s radiative output.
Temperature and Current Density
There is a natural relationship between temperature, or color, of a main sequence star and the current density at the star’s surface, which produces the modified HR main sequence. At the lower left-hand end we find the red dwarfs – small stars under low electrical stress, so that anode tufting is sparse and the light from the tufts is emitted at low energies, at the red end of the spectrum. A good deal of the red light may also come from the chromospheric anode glow.
As we move diagonally upward and to the right on the H-R diagram the stars become more massive and the current density increases. Anode tufting becomes more intense and the tufts’ mutual repulsion forces the photosphere to grow to accommodate them. At the top right of the main sequence the light from the tufts is the electric blue of a true arc and the stars appear as ‘blue giants’—intensely hot objects considerably larger than our Sun. These blue giants tend to be concentrated on the central axes of our galaxy’s spiral arm.79
Stars under this degree of electric stress have only one way to reduce it – they must fission into two stars with a greater total surface area. This process provides an upper limit to the size of a star. The binary remnants will then be situated at a lower point on the main sequence.
77 D. E. Scott, The Electric Sky, pp. 96-7.
78 See the 1999 Fall Meeting of the American Geophysical Union: www.lanl.gov/news/releases/archive/99-180.shtml
79 Bruce C. E. R., “A New Approach in Astrophysics and Cosmogony,” London (1944); Philosophical Magazine, vol. 3, pp. 539ff, (1958).
In fact this very fissioning process seems to have occurred in the famous supernova 1987A. The event caught astronomers by surprise because blue stars are supposed to be young stars and supernovae are supposed to occur at the end of a star’s life, the red giant stage, not at the ‘beginning,’ the blue giant phase. And instead of fizzling out, the supernova remnant is now growing brighter. Electrically, this is to be expected because the matter thrown off in the supernova explosion temporarily tends to sweep up electrons and remove them from the discharge. With time, the new stars will settle into the electrical environment and establish their new positions on the HR plot.
The two pictures above show the theoretical fate of the Sun, billions of years from now. The electric model of stars tells a totally different story. If stars are reliant on an external source of power there is no simple evolutionary path. In a sense, all stars are variable. This realization is important in earthly climate debates. Credit NASA/CXC/AO
Red giants and white dwarfs
The HR diagram features two groups of stars that are separated from the main sequence – the red giants and white dwarfs, seen on opposite sides of the diagonal ‘main sequence.’ Astrono- mers view red giants in terms of the evolutionary sequence de- fined by the nuclear theory of stars. Red giants must be experi- encing the ‘energy crisis’ that the model requires when a star begins to deplete its non-renewable energy source. In this defi- ciency it suffers ‘collapse.’ As stated on the Chandra X-ray Ob- servatory website: “A shell of hydrogen on the edge of the col- lapsed core will be compressed and heated. The nuclear fusion of the hydrogen in the shell will produce a new surge of power that will cause the outer layers of the star to expand until it has a diameter a hundred times its present value. This is called the ‘red giant’ phase of a star’s existence.”
This explanation of red giants appears so frequently that a reminder is necessary. It is a guess. It is complicated and
unverifiable, requiring events occurring unseen in the interior of the star, where ‘radiation pressure’ from a core super-heated by a loss of fuel produces a bloated envelope. The story then moves from one extreme to the other, as the red giant passes into the supposedly ‘final’ ‘white dwarf’ stage, where it collapses from the size of the Sun to an object less than the size of the Earth.
Has the sequence ever been observed? No. Is it reasonable to sup- pose that stars can collapse to become ‘super-dense’ objects? No. The concept violates elementary rules of physics. Observationally, we can only say that matter compressed gravitationally will become a liquid or a solid, at which time it is essentially incompressible.
In the absence of experimental support, astrophysicists use a model of white dwarfs assuming electrically neutral stellar matter.80 An electric star model is quite different. It has no phenomenally hot
80 E. Schatzmann, White Dwarfs, pp.43-5. To “a high degree of approximation the matter is electrically neutral. It is simpler to start from the conditions of electrical neu- trality.”
core within and therefore ionization is slight throughout the star. Atomic nuclei, many thousands of times heavier than their orbiting electrons, are offset by gravity away from the center of each atom to- ward the center of the star. So each atom forms a tiny atomic electric dipole. The dipoles align to produce a radial electric field inside the star. Long before growing pressure can create a ‘super-dense’ object, any free electrons will drift toward the surface under the influence of the radial electric field. The vastly stronger electric force (positive ions repelling positive ions within the star) will oppose gravitational com- pression.
The notion that faint white stars are collapsed ‘dwarfs’ is a conclusion from abstract reasoning, not observation. The conclusion followed from the assumption that all stars use the same internal processes to produce their light. But Eddington himself expressed his puzzlement about white dwarfs: “Strange objects, which persist in showing a type of spectrum entirely out of keeping with their luminosity, may ultimately teach us more than a host which radiates according to rule.”81 He was right.
Is it possible to account for both red giants and white dwarfs without guessing about what is inside a star? It is possible, but only by suspending standard theoretical assumptions. We reject the modern habit that treats mass and matter as interchangeable concepts. The electrical model does not assume that a given quantity of matter will produce a given gravitational perturbation (i.e., ‘mass’). It sees gravity itself as an induced subatomic dipolar electrical force, and when electrical conditions change, mass can change with no change in the quantity of matter. Or, to state the point differently, mass, as measured by gravitational perturbation, is not a measure of the amount of matter in a celestial body. Hence, calculations of density, composition, or internal structure of a star, based on the star’s gravitational effects, are unreliable (as if to confirm this point, our own Sun oscillates radially as though it were the same density throughout—a gross violation of astrophysical assumptions about the Sun).82
White ‘dwarfs’ and low-energy discharge
Electric stars may exhibit different modes of the anode discharge phenomenon that produce quite distinctive appearances. So for completeness of the electrical model of stars, we need to address situations where the bright anode tufting above the star’s surface is not
81 A. Eddington, “Centenary Address,” 1922, RAS Monthly Notices 82, 436.
82 A. B. Severny, V. A. Kotov. & T. T. Tsap, “Observations of Solar Pulsations,” Nature Vol. 259, Jan. 15, 1976, pp. 87-89. “The simplest interpretation is that we observed purely radial pulsations. The most striking fact is that the observed period [160 min- utes] is almost precisely ... the value if the Sun were to be an homogeneous sphere.
... We have investigated two possible solutions to this dilemma. The first alternative is that nuclear ... reactions are not responsible for energy generation in the Sun.”
required for a stable discharge. This will allow us to address the differences between main sequence stars on the one hand, and red giants and white dwarfs on the other. The terms ‘giant’ and ‘dwarf,’ applied to stars, are highly misleading. And the notion of a star’s age, based on its appearance, has no validity. In the electrical model, both the luminosity and the mass of a star are non-linear variables. Both depend upon the star’s electrical state, which has no connection to its age. Stellar color and luminosity are discontinuous functions for good reason: plasma discharge phenomena at the anode exhibit sharp discontinuities. Nuclear star models projecting theoretical ‘life-spans’ onto the HR diagram require great imagination to explain these discontinuities.
In the simplest situation a star is in direct contact with the plasma of space. That is, the star’s discharge current is satisfied by all approaching electrons that reach the anode (star)—including drift electrons plus others that randomly move toward the star.83 Plasma experiments show that a plasma sheath must exist between the dissimilar plasmas of space and the star. But at lower energies (per square meter of surface) there there will be no intensely bright tufting within the plasma sheath. That would seem to be the case for white dwarfs.
The notion that these low luminosity stars are ‘dwarfs’ comes from applying the astronomers’ mass-luminosity assumptions to the HR diagram. But these stars may, in fact, be among the largest since a large surface area is better able to cope with electric stress than a small area. Alternatively, of course, the star may be of normal size and the electrical stress in its environment simply lower than usual. In particu- lar, this would be something to look for in a multiple star system where another star in the group controls most of the power flow through the system.
The white color and very high temperatures of white dwarfs— tens of thousands of degrees—can now be understood. In the lower- energy discharge environment, the direct contact of the ambient plasma with the atmosphere of the star leads to discharge without an- ode tufting, the source of main sequence stars’ luminosity. As usual, a thin plasma sheath will be formed between the plasma of the star and the plasma of space. The electric field across the plasma sheath is ca- pable of accelerating electrons to generate X-rays when they hit atoms in the atmosphere. And the power dissipated is capable of raising the temperature of a thin plasma layer to tens of thousands of degrees. It is rather like moving a low-energy corona of a main sequence star down into the denser atmosphere of the white dwarf star.
83 R. E. Juergens, “The Photosphere: Is it the top or the bottom of the phenomenon we call the Sun?,” KRONOS Vol. IV, No. 4, Summer 1979, p. 39.
Though science has much to learn about these mislabeled stars, observational evidence supports an electrical interpretation. White dwarfs do show the broadening of spectral lines expected in the pres- ence of an electric field. In fact, the broadening is so great for the lightest element, hydrogen, that the spectral lines smear into the con- tinuum. The result is that most white dwarfs, on a strict reading of the spectrum, would appear to have no hydrogen!
White dwarfs are often found in multiple star systems, which puz- zles astronomers because “it is not easy to understand how two stars of the same age could be so different.”84 The answer is simple. The appearance of stars has nothing to do with their age. White dwarfs should be expected in multiple star systems because one or other members of the stellar system have diverted its electrical power.
A good example is the nearby double star system of Sirius, which is the brightest star in the sky and one of the closest. Sirius also has a partner, called Sirius B, a ‘white dwarf.’ To our eyes, it is 10,000 times fainter than the primary star, Sirius A. However, when as- tronomers pointed the Chandra X-ray tele- scope at Sirius, they got a shock. In the X-ray image (right), Sirius A is the lesser of the two lights. Sirius B, the white dwarf, is the greater. It is the reverse of what we see with human eyes.
White dwarfs are thought to be the origin of sudden stellar out- bursts known as dwarf novae and supernovae. Since the electric model sees a white dwarf in relation to a multiple star system, it expects pe- riodic catastrophic releases of stored electrical energy, which would show up as a sudden star-wide electric discharge. Other features ex- hibited by this class of stars suggest similar electrical connections be- tween stellar partners. White dwarfs are subject to ‘flickering,’ with changes in light output in mere seconds or minutes. It is this feature that gives rise to their designation as ‘cataclysmic variable’ stars. The flickering is to be expected from white dwarfs because, lacking the anode tufting of main sequence stars (the ‘PNP transistor’), the entire glowing plasma sheath responds immediately to variations in power input. In addition—in radical contrast to main sequence stars—dis- charges from an encircling plasmoid or close companion star will cause bright arcs, or UV and X-ray emitting hot spots, instead of dark sunspots.
In seeking to resolve the puzzling behavior of close binary stars, astrophysicists should consider the predictive ability of an electric model, which reaches far beyond mere gravitational interactions.
Here we see the essential electrical difference between a white dwarf, Sirius B, and its binary partner, a “main sequence” star, Sirius A. Sirius A’s visual brightness is due to intense plasma tufting above the anode sur- face, where the electric field is very weak and so it does not produce X- rays. Its X-rays, seen in the top image are generated in the diffuse corona, like the Sun. However, like an X-ray tube in a surgery, the electrons im- pinge directly on the anode in the case of Sirius B causing it to shine much brighter than its partner, Sirius A.
Credit: NASA/SAO/CXC/McDonald Observatory
84 E. Schatzmann, White Dwarfs, p. 163.
Image of the red giant star, Betelgeuse, showing the ‘hot spot.’ Credit: NASA
Expanding Red Giants
It may seem paradoxical that red giants may be formed by stars smaller than a ‘white dwarf!’ But the paradox is removed by de- tailed observations of plasma discharge behavior. In the same way that the glowing regions in a discharge tube expand or contract along the tube when the applied voltage is varied, the glow dis- charge phenomenon we call a star may also expand or contract.
In its formative phase, the star is in a state of profound electron deficiency. To achieve balance, it must collect more electrons than the plasma can deliver continuously to its surface. So the anode re- sponds by expanding its influence, forming a negative space-charge sheath (plasma cell or double layer). The sheath grows until its ‘sur- face’ or outer boundary is of sufficient size to intercept drift or ran- dom electrons in sufficient numbers to maintain the anode current.
In this condition, the outer boundary of the sheath, though negatively charged in relation to the anode it encloses, becomes the effective anode surface in relationship to the plasma surrounding it. Now, even the slowest electrons under the influence of the sheath are accelerated toward the (true) anode.
In other words, in its ‘search’ for electrons, the sheath expanding into the primary plasma effectively increases the size of the anode and increases the current density in the discharge plasma. The process is self-limiting because, as the sheath expands, its electric
field will grow stronger and stronger. Electrons caught up in the field are accelerated to ever-greater energies. Before long, they become energetic enough to excite neutral particles they chance to collide with, and the sheath takes on a uniform ‘red anode glow.’ It becomes a red giant star.
The electric field driving this process will also give rise to a mas- sive flow of positive ions away from the star, or in more familiar words—a prodigious stellar ‘wind.’ Indeed, such mass loss is a charac- teristic feature of red giants and is unexplained since the star is said to be too ‘cold’ to ‘boil off’ a stellar wind. So when seen in electric terms, instead of being near the end point of a star’s life, a red giant may be a ‘child’ losing sufficient mass to begin the next phase of its exis- tence—on the main sequence!
If the red giant diminishes in size, a point is reached where ioniza- tion of neutral matter sets in. Particles are no longer merely excited by having electrons bumped to higher orbits but actually are stripped of one or more electrons in collisions. When ionization becomes appre- ciable, the sheath itself breaks down, and a new mode of anode dis- charge is established. Before breakdown, the sheath is a faintly glow- ing coat over the anode surface. Then, suddenly, at one or more points of intensified activity, small tufts of secondary plasma spring into be- ing; the mildly luminous sheath gives birth to bright plasma anode tufts, each of them filled with positive ions and free electrons that were
not there earlier. The red giant star, Betelgeuse, shows signs of that condition. It has been found to have a bright ‘hot spot,’ which may be the beginnings of a main sequence star beneath the red anode glow.
Variable Stars
We cannot end this subject without addressing the im- plications for other stars. In January 2002, Australian ama- teur astronomer Nicholas Brown noticed a star in the con- stellation Monoceros that wasn’t there two weeks earlier. Over the next month, astronomers watched this ‘new’ star become brighter than any other star in our galaxy and then fade away again.
A few weeks later V838 Mon was surrounded by an expanding glowing cloud. By March 2002 the star was 800 times larger than the Sun and the coolest super giant ever seen—at around 4,000 Kelvin. Seven months later, it was little more than 1,000K. “Initially thought to be a familiar type of classical nova, astronomers quickly realized that in- stead, V838 Mon may be a totally new addition to the astro- nomical zoo. Observations indicate that the erupting star transformed itself over a period of months from a small
under-luminous star a little hotter than the Sun, to a highly-luminous, cool supergiant star undergoing rapid and complex brightness changes. The transformation defies the mainstream understanding of stellar life cycles.”85 One investigator was moved to declare; “The real explanation is probably something that no one has thought of yet.”86
Like more than half of all stars, V838 Mon is a binary pair. The electric model of stars explains why binaries are favored. If the electri- cal stress on a star’s surface is high it may fission into two stars in a nova outburst. The surface area of two stars is greater than the original star, so the new system is better able to cope with electrical stress.
V838 Mon has all the basic characteristics of fissioning to relieve electrical stress: nova-like brightening followed by loss of luminosity and loss of temperature; changing to a different spectral type with marked changes in its surface chemical composition; discovery of a binary companion; and the appearance of an expanding nebulous cloud.
It demonstrates that stars may change places overnight on the conventional charts of their evolution. If stars are primarily products of their electrical environment then the evolutionary story of the birth, life and death of stars is wrong.
V838 Monocerotis Credit: NASA/ESA
85 H. E. Bond, et al., “An energetic outburst accompanied by circumstellar light echoes,” Nature, Vol. 422, 27 March 2003, pp. 405-7.
86 D. Shiga, “Bizarre stellar outburst continues to baffle,” New Scientist, 30 October 2006.
When a star called ‘SK-69 202’ exploded on February 24, 1987, becoming ‘Supernova 1987A,’ the shock to mainstream theory was as great as the visual wonder in the heavens. The event did not ‘emulate the theory,’ but rather appears to have involved catastrophic electrical discharge in the classic ‘hourglass’ shape or ‘Z-pinch’ configuration.
Prior to Supernova 1987A, astronomers assumed that a supernova signaled the death throes of a red supergiant star. But the star that exploded— SK-69 202 —was a blue supergiant, perhaps 20 times smaller than a red supergiant and a much different breed of star. Both the luminous beaded torus around the star, and the ‘enigmatic’ bi-polar rings are predictable features of electric discharge in the laboratory. See picture opposite.
Credit: Nasa/Hubble
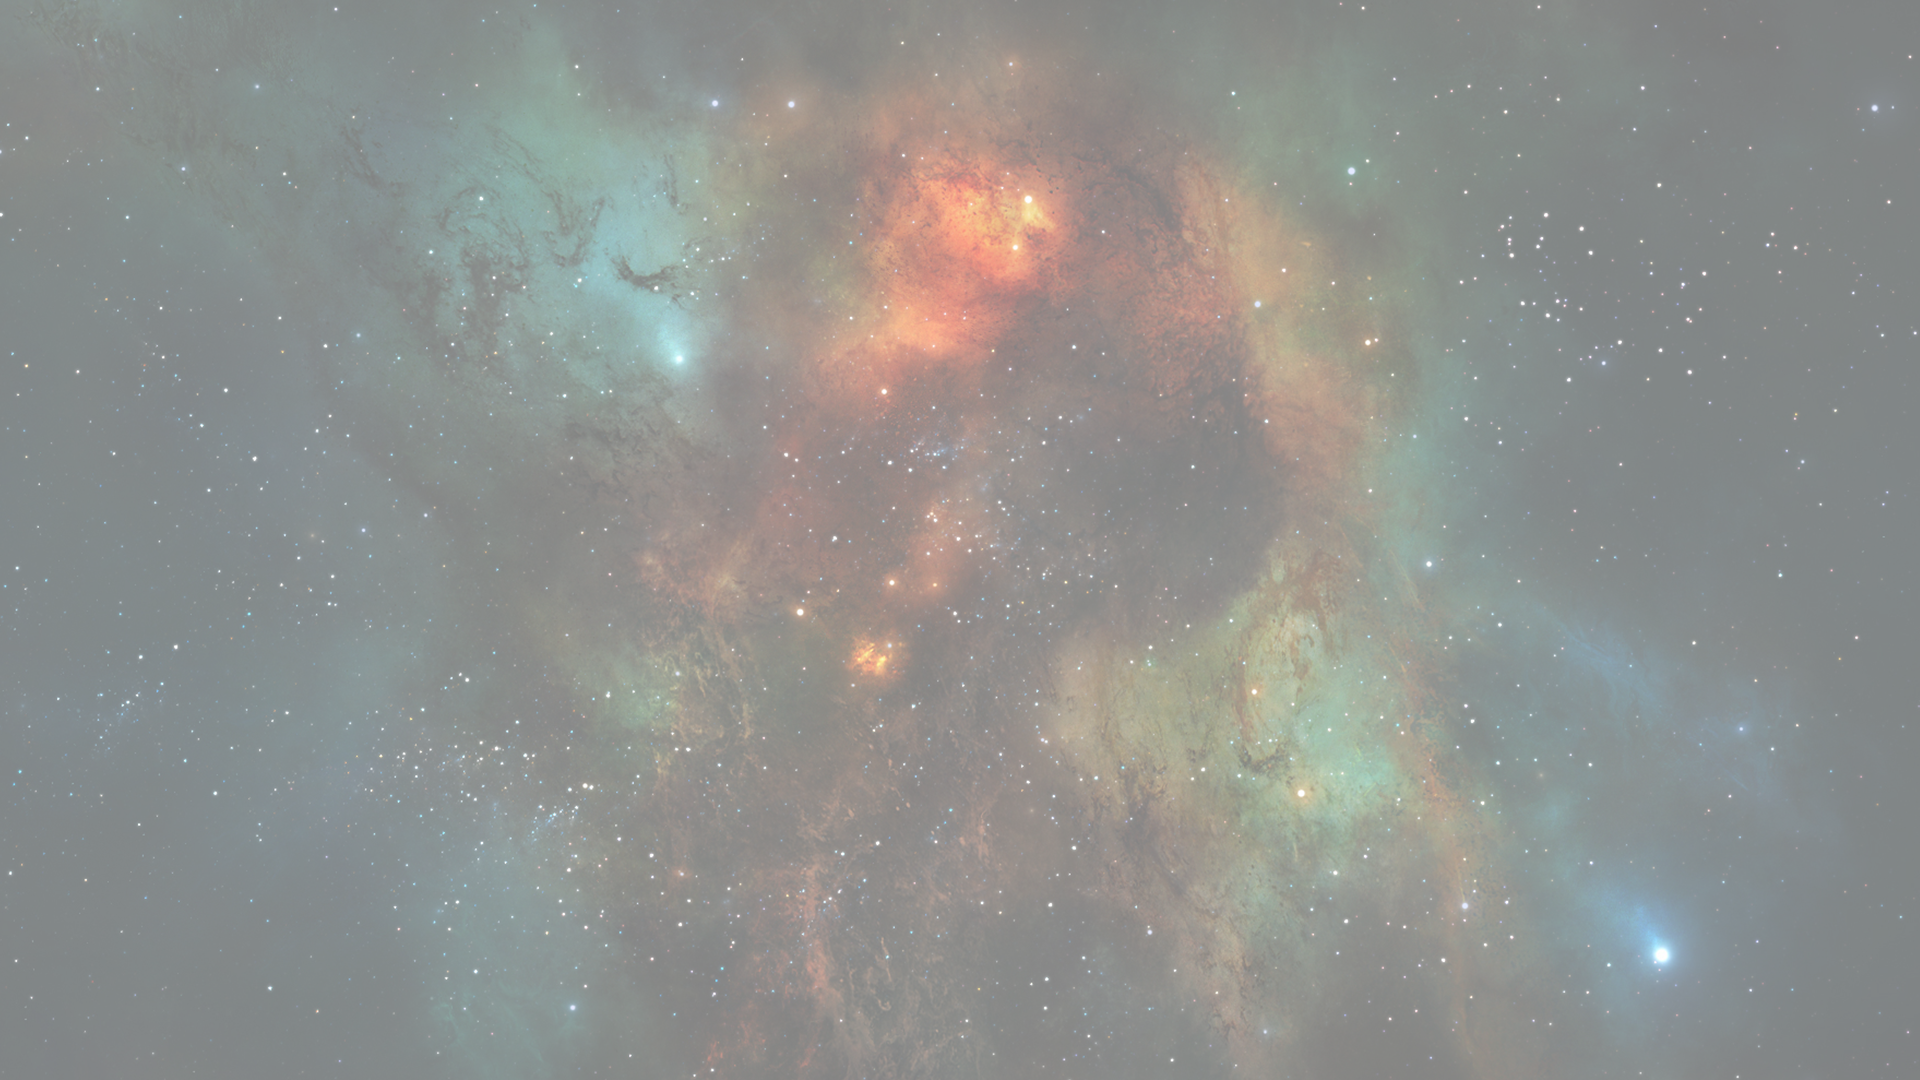
Supernova remnant RCW 103. Recently, astronomers announced the discovery of a “mystery object” that, according to conventional wisdom, should be a very “young” neutron star, yet behaves like one that is several million years old.
Astronomers were stunned by its emission cycles—tens of thousands of times longer than theory had postulated for “a freshly created neutron star.” Credit: ESA/XMM-Newton/A.De Luca (INAF-IASF )
Supernova 1987A
Supernova (SN) 1987A is the closest supernova event since the invention of the telescope. It was first seen in February 1987 in the nearby Magellanic cloud, a dwarf companion galaxy of the Milky Way, and only 169,000 light years from Earth. Close observation since 1987 has now provided proof that supernovae are catastrophic electrical discharges focused on a star.
A supernova is one of the most energetic events witnessed in the universe. The accepted explanation is that it occurs at the end of a star’s lifetime, or red giant stage, when the star’s nuclear fuel is exhausted. There is no more release of nuclear energy in the core so the huge star collapses in on itself. If sufficiently massive, the imploding layers of the star are thought to ‘rebound’ when they hit the core, resulting in an explosion, and the blast wave ejects the star’s envelope into interstellar space. The implosion of the stellar core is supposed to produce a rapidly spinning, super-collapsed neutron star.
The bright equatorial ring is caused by the collision of exploded matter from the star with the remnants of an earlier stellar ‘wind.’ The two faint rings are a problem. The best that theorists have been able to manage is to propose a rotating beam from a supernova pulsar remnant, sweeping and lighting up a shell of gas expelled at an earlier epoch. The ad hoc nature of these explanations is obvious.
It is believed that a pulsar must be a tiny neutron star that can spin up to thousands of times a second without flying apart. Somehow it contrives to emit a rotating beam of X-rays (like a lighthouse). Com- monsense suggests that this mechanical model is wrong when some pulsars spin beyond the tachometer redline, even for such a bizarre ob- ject. Meanwhile, plasma physicists have shown that complex pulsar
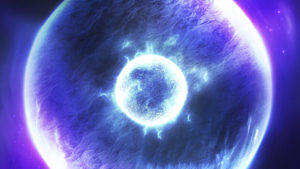
LEFT:: Experimental and simulation derived geometries for extreme plasma currents in a plasma column. The Birkeland currents will only be visible where the plasma density is high. It can be seen how well the shape matches that of SN 1987A.
signals can be explained by plasma discharges in a stellar magnetosphere.87
The bright beaded ring of the supernova shows that matter has been ejected equatorially from the star. However, the ring is not expanding as expected from an explosion. The other two fainter rings are also arranged above and below the star on the same axis and show similar but fainter ‘bright spots.’ Conventionally, a shock wave from an exploding star should show spherical, rather than axial, symmetry. And there is no particular reason why the shock front should form a ring of bright spots.
It is obvious the image of SN 1987A shows the cylindrical Birke- land currents around the star have paired to a number close to 28. The number of bright spots and their tendency toward pairing and groups of three, is seen in experiments on Earth. The z-pinch model explains why the glowing ring is so nearly circular and is expanding very slowly - unlike a shock front. It is more like a cloud at night moving through the beams of a ring of searchlights.
If the equatorial ring shows the Birkeland currents in the outer sheath of an axial plasma current column, then the supernova outburst is the result of a cosmic Z-pinch in the central column, focused on the central star.
This simple electric discharge explanation stands in stark contrast to the complex mainstream story of a supernova explosion. It is a story that still defies theoretical analysis based on an implosion followed by an explosion.88 However, it should be possible, based on electrical experiments, to predict the future behavior of SN1987A. That is something the standard model has been unable to do.
The spectacular Hourglass Nebula renders visible the characteristic Z- pinch shape of the plasma discharge focussed upon a star.
Credit: R. Sahai, J. Trauger (JPL), the WFPC2 science team and NASA.
87 K. R. Healy, A. L. Peratt, “Radiation Properties of Pulsar Magnetospheres,” Astro- physics & Space Science 227: pp. 229-253, 1995.
88 D. C. Leonard, “for all the fanfare and empirical success, it must be acknowledged that we are fundamentally ignorant. We do not know how these stars explode.” “A Supernova Riddle,” Science Vol. 315, p. 193.
Dr. S. R. Taylor Image: Australian Institute of
Physics
A satellite orbiting within the red anode glow of a dwarf star receives the same energy per unit area globally. Image:
- Thornhill
Coming to Terms with Electric Stars
Electric stars raise countless issues about our place in the universe. Later monographs will address more of them.
At first the idea of electric stars is unsettling. The comforting story about the history of the Sun and its reliability for billions of years into the future is gone. However, nearby stars in the Milky Way look peaceful enough. But there is no guarantee the Sun will shine steadily for millions, let alone billions, of years into the future.
Electric stars offer radically new ideas about life on other worlds and the search for extra-terrestrial intelligence (SETI). Dr. Ross Taylor concluded after a lifetime’s study of the solar system: “When the remote chances of developing a habitable planet are added to the chances of developing both high intelligence and a technically advanced civilization, the odds of finding ‘little green men’ elsewhere in the universe decline to zero.”89 His bleak assessment is instinctively wrong. A galactic source of electrical energy provides more possibilities for sustaining life than the lottery of finding an earth-like planet orbiting in a narrow ‘habitable zone’ about a bright star.
Imagine Jupiter and its moons, outside the Sun’s influence. Jupiter would become a dim star (brown dwarf) enclosed in the radiant red shell of its ‘anode glow.’ It is a hospitable environment for life be- cause the radiant energy arriving on a satellite orbiting inside a glow- ing sphere is evenly distributed over its entire surface (see left). There are no seasons, no tropics and no ice caps. A satellite does not have to rotate and its axis can point in any direction.
The radiant energy will be strongest at the blue and red ends of the spectrum. Photosynthesis relies on red light. L-type brown dwarfs have water as a dominant molecule in their spectra, along with many other biologically important molecules and elements. Its satellites would accumulate atmospheres and water would mist down.
The problem for SETI is that no radio signals could penetrate the glowing plasma shell. Nor would any intelligent life forms be aware of the spectacle of the universe that we are privileged to witness.
What about climate change? It is an enigma that the most violent weather is to be found on the most distant planets. The answer is that the planets are in the Sun’s electrical circuit. And the power supply is unregulated—unlike solar radiant energy. Electrical energy is a factor unknown to climate modelers. Yet water is an electrically polarized molecule, so that storms and tornadoes are electrical phenomena. If we wish to modify climate, the way ahead may be in electrical weather modification.90 New possibilities abound.
89 The Leonard Award Address: “On the Difficulties of making Earth-like planets,” S.
- Taylor, Meteoritics & Planetary Science 34, 317-29 (1999).
90 “Electric Rainmaking Technology Gets Mexico's Blessing,” IEEE Spectrum, April 2004.